$

CI/CD Docker Pipeline
with AWS Notifications
& Monitoring

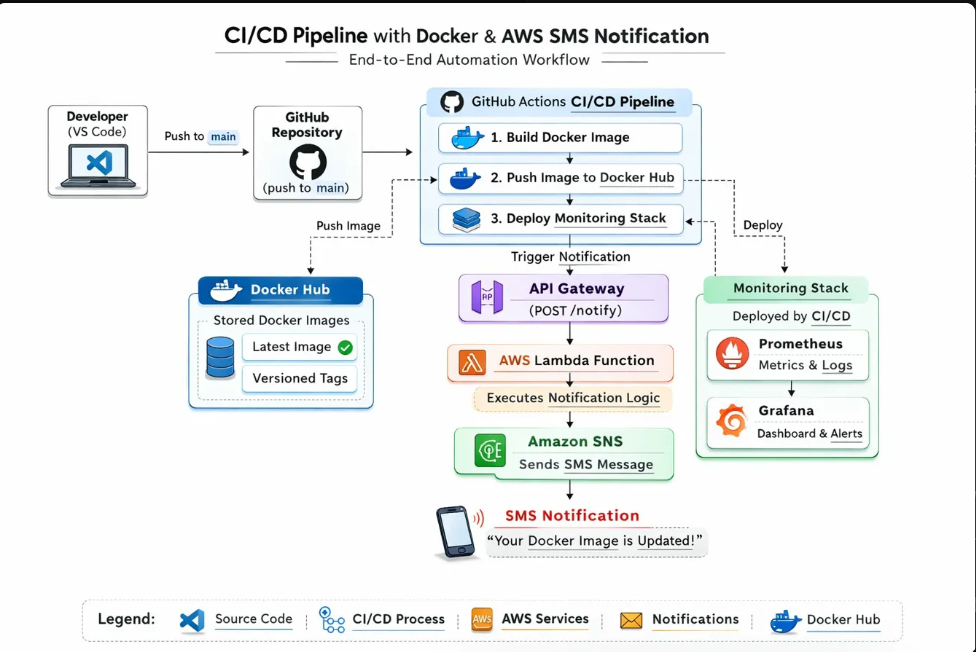
End-to-end DevOps automation — from code push to deployment, real-time SMS alerts, and live monitoring dashboards.

GitHub Actions
Docker
AWS Lambda & SNS
Live SMS Alerts
Prometheus
Grafana
💻
VS Code
🐙
GitHub
⚙️
GH Actions
🐳
Docker Hub
🌐
API Gateway
λ
Lambda
📱
SNS SMS

Architecture Overview

Complete end-to-end automation workflow

CI/CD Architecture Diagram
0 % Automated
0 Core Services
0 Cloud Components
0 SMS Delivery

How It Works

The complete pipeline flow — four key stages

01

Code Push & CI/CD Trigger

Developer pushes code from VS Code to a GitHub repository. This triggers an automated CI/CD pipeline built using GitHub Actions.

02

Build & Push Docker Image

The pipeline builds a Docker image of the application and uploads it to Docker Hub with versioned tags and latest image tracking.

03

Serverless Notification

A POST request hits API Gateway, triggering a Lambda function that publishes to Amazon SNS — sending an SMS confirming deployment.

04

Monitoring & Observability

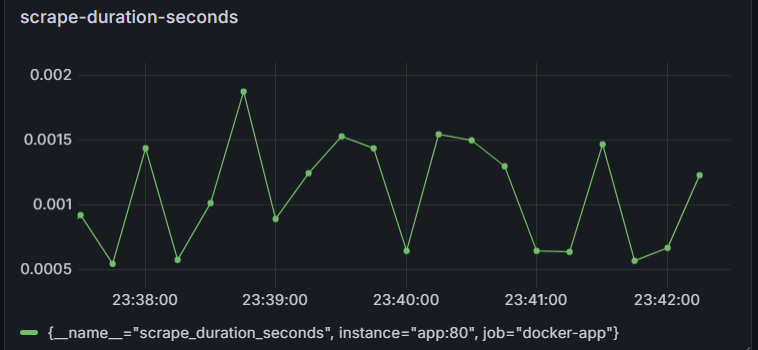
Prometheus collects metrics from running containers. Grafana provides real-time dashboards for system health, performance, and alerts.

Implementation Details

Three major components working in concert

🔄

CI/CD Pipeline

  • GitHub Actions workflow triggered on push to main
  • Builds Docker image from Dockerfile
  • Authenticates with Docker Hub using secure credentials
  • Pushes image with versioned tags to registry

Serverless Notifications

  • API Gateway HTTP API with POST /notify endpoint
  • AWS Lambda executes notification logic
  • IAM role grants SNS publish permissions
  • Amazon SNS delivers SMS to configured number
📊

Monitoring Stack

  • Docker Compose orchestrates all services
  • Prometheus scrapes container metrics
  • Grafana dashboards visualize real-time data
  • Port-mapped for local browser access

Monitoring Dashboard

Grafana visualization with Prometheus data source

Grafana Dashboard

Access Locally

App localhost:8080
Prometheus localhost:9090
Grafana localhost:3000

Key Outcomes

What this project demonstrates

Automated deployment pipeline using industry-standard CI/CD tools
Containerized application with Docker and Docker Hub registry
Serverless notification system with API Gateway, Lambda & SNS
Real-time monitoring with Prometheus metrics and Grafana dashboards
SMS alerts on every successful deployment
Unified workflow combining CI/CD, cloud services & observability